

A dashboard is an indispensable tool. It is not only a question of following statistics (via Prestashop or Google Analytics) but of having a tool that allows you to monitor your activity regularly but also to take the necessary perspective.
From the putting your e-commerce site online and from the very first orders, you will be inundated with data. The dashboard then allows you to focus on the essentials to carefully monitor your KPIs. We're calling KPI (for Key Performance Indicator) the key data that most reveals your business.
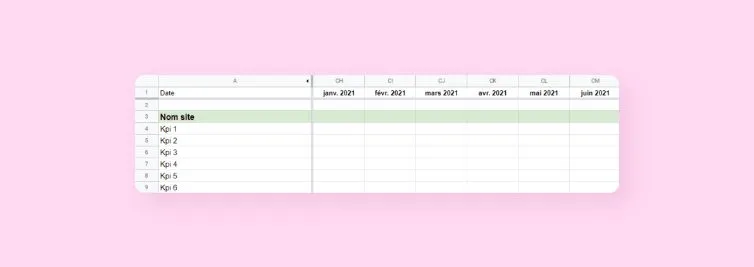
Here is an example, to be adapted to your needs.
When you start, using a simple spreadsheet, such as Excel, Libre Office or Google Docs, is sufficient.
The essential KPIs
Number of visits (unique): It's mathematical, to get orders you need visits. It is therefore important to measure the growth of your visits compared to the growth of your business.
Bounce rate : it represents the number of people arriving on your site and leaving immediately (visit to an interaction). Your goal should be to lower this rate over time. A good bounce rate is generally between 40 and 55%... A figure to be taken with caution depending on the activity.
Your Shopify agency or your Prestashop agency will give you valuable advice to reduce your bounce rate. A few essential questions can guide your thinking:
- Are the products shown on the home page the headliners
- Is the teaser text well-constructed
- Is the offer adapted to visitors
- Are the texts and product sheets well informed
- Are the return conditions reassuring
Conversion rate : the relationship between the number of visitors and the number of orders. This rate, on a national average, is 0.90%. However, be aware that it is much easier to obtain this rate for a site making 300 orders per day than for a site that is just starting up! Notoriety and trust undeniably play in favor of this index.
Number of sales : The basis for the development of your customers, and therefore of your turnover.
Turnover: it is your source of income. It is the favorite KPI of your accountant and your banker!
Average basket : what a customer spends on average per order on your site. Try to improve the user experience by offering complementary products. You can also suggest products that are slightly higher in range, by valuing their benefits for a few euros more... You will see, the average basket will tend to increase, and you will benefit from more profitable traffic.
Social media activity : Fans on Facebook, followers on Instagram... Today, we consume much more than a product: we follow a community! Brand image and social influence are the components of an effective strategy that will strengthen your reputation. Not sure where to start? Rely on Axome's Social Media Support offer. It is also a way to improve your natural referencing.
Marketing campaigns (Google Ads, Affiliation, Mailing...) : This is a crucial point! A campaign, whatever it is, must ultimately guarantee a return on investment. And monitoring its impact on your dashboard will allow you to know if you should continue or question this campaign.
So imagine doing a promotion A in January and a promotion B in February. If promotion A proves to be more effective than promotion B, you can learn from it and therefore enrich your experience.

You can also use as a KPI: the number of customer accounts created, the number of abandoned carts, the loyalty rate...
Other tips
- You can include, in a second table, your logistical data or your refunds, credit notes, discount vouchers... It is always useful. Be careful, however, to remain simple and not to transform it into an accounting dashboard because that is not the point.
- Use colors to notice successes and failures.
- Do not hesitate to draw curves in order to more easily identify your successes and areas of progress.

A dashboard, to accompany the chart
As a Prestashop agency and a Shopify agency, Axome gives you the keys to consolidate the growth of your e-commerce site. A simple tip that makes a difference? Record and date your actions!
You will see, after a year of activity it can become very complicated to remember why in July you achieved much more than in June or much less than in September...
All you have to do is write down your actions in a word processor, with synthetic self-criticism. You can't imagine how much you can learn from your experiences!
Example:
Action : From June 1 to June 15, I did a test on a paid price comparison as part of a spring trial promo. I mainly distributed my products from such and such departments with an immediate 10% discount.
Result : My sales on products in this department were multiplied by 3 while on this other department I sold almost nothing (do not hesitate to quantify or create a specific dashboard).
Analysis : That this product worked well is logical given the approach of summer vacation and my promotion. Next year I will find new products of this type. In addition, I was the only one to offer it for less than €20 on the Internet, so I had a significant competitive advantage. On the other hand, on the other department the product has been out of fashion for a year and even the 10% promotion was not enough, so I will do 20% in July to be sure to get rid of my stock. Next year I will make 20% off immediately in June on this type of product.
An e-commerce dashboard must evolve
You will quickly get used to it and become addicted to your favorite spreadsheet! Keep the KPIs essential and always ask yourself the question of the importance of each piece of data. So develop your chart by identifying each of your actions, set goals, make forecasts based on your experience...
You can also study very specific time periods. For example, if you know that Easter is a period when you explode your numbers, do not hesitate to bet more on advertising during this period and then review your operation.
Conclusion: the basic tool to boost your e-commerce
Your dashboard is the cross-tool of your various sources of statistics and proves to be a real analysis tool.
It enriches the knowledge of your target, your products, your market and your business.
Keep a minimum of perspective on these numbers. Even if it turns out that an operation was wrong, ask yourself about ways to reverse the balance. Never be satisfied with your results, always look for more...
We cannot repeat it enough, but the quality of your photos and product sheets is always synonymous with conversion rates and referencing.
Imagine going from 0.9% to 1.4% conversion on 1000 visits per day with an average basket of €150. This represents 5 more orders, or €750 in savings!
This tool will also be your interface for exchange with your SEO and webmarketing project manager. In general, it uses more complex tables but it will still need the numbers listed in your dashboard. (If it does not exist, his first action will be to set it up)
Your project manager is also there to advise you in your choices and support you in implementing solutions. Your dashboard will allow him to have a sharp eye on your activity, to obtain much better results.